 KC
KC
@
12:10p
 TB
TB
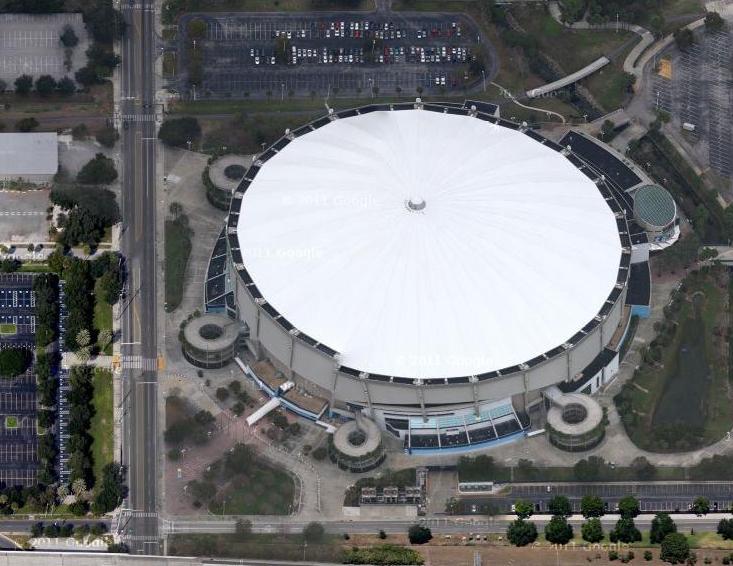
Stadium Conditions
Tropicana Field
First pitch 12:10p
· roof unknown
Park 0.93×
Wind 0 mph dome
—
unknown
Hourly forecast unavailable; showing current stadium conditions only.
⚪ Soft suppress · Combined 0.93
Dome — weather irrelevant. Park, wind, temperature, and roof are inputs to Combined, not separate signals to stack on top.

8 batters
| # | Batter | Score | Tier | Odds | Form | Rank | ISO ?Isolated Power — career SLG minus AVG. >.220 elite, .180–.220 above avg, <.140 below avg. | EV ?Avg Exit Velocity (mph) — Statcast season-to-date. >92 elite, 89–92 above avg, <86 below avg. | Barrel% ?Barrel rate vs. this pitch mix — percentage of contact classified as barrels (perfect EV + LA combo). >12% elite, 8–12% above avg. | HR/FB ?Batter HR / Fly Ball rate for this matchup. A vs LHP/vs RHP chip means a handedness split is shown; otherwise the value is overall. | HR Dist ?Average distance (ft) of this batter's HRs. >400ft elite raw power, 380–400 above avg. | Sea HR% ?Season HR rate (HRs / PAs so far this year). v3.5 model feature — top backtest contributor. | 14d Pace ?Recent 14-day HR pace (HRs / games started). v3.5 model feature — captures current form. | Match% ?HR/FB Matchup — combined batter × pitcher HR/FB rate. The headline "how favorable is this matchup" number. | BBE ?Sample size — batted-ball events. <30 = small sample, treat stats with caution. | |
|---|---|---|---|---|---|---|---|---|---|---|---|---|---|---|---|---|
| 1 |

|
Jac Caglianone | 61 | 🔵 C+ | · | · | 15 | 0.217 | 93.9 | 11.5% | 29.0% vs RHP | 418 | 14.3% | 30.8% | 22.1% | 35 |
| 2 |

|
Carter Jensen | 47 | ⚪ D | · | 🌧️ COOL | 57 | 0.183 | 91.1 | 8.1% | 17.0% vs RHP | 381 | 13.8% | 16.7% | 9.7% | 43 |
| 3 |

|
Nick Loftin | 46 | ⚪ D | · | 🌤️ WARM | 58 | 0.182 | 88.1 | 7.5% | 13.3% vs RHP | 400 | 11.5% | 20.0% | 12.2% | 32 |
| 4 |

|
Salvador Perez | 42 | ⚪ D | · | 🌤️ WARM | 72 | 0.154 | 88.8 | 8.7% | 16.7% vs RHP | 394 | 14.8% | 0.0% | 8.6% | 41 |
| 5 |

|
Lane Thomas | 39 | ⚪ D | · | 🔥 HOT | 83 | 0.125 | 87.5 | 6.0% | 17.4% vs RHP | 413 | 14.3% | 27.3% | 12.4% | 36 |
| 6 |

|
Starling Marte | 32 | ⚪ D | · | ❄ COLD | 113 | 0.076 | 89.7 | 9.9% | 6.7% | 441 | 3.8% | 0.0% | 6.3% | 16 |
| 7 |

|
Isaac Collins | 29 | ⚪ D | · | 🌧️ COOL | 121 | 0.088 | 88.6 | 7.0% | 6.1% vs RHP | 377 | 4.5% | 0.0% | 5.9% | 34 |
| 8 |

|
Tyler Tolbert | 21 | ⚪ D | · | 🌤️ WARM | 136 | 0.039 | 82.2 | 6.8% | 0.0% | 0 | 0.0% | 0.0% | 5.5% | 11 |

8 batters
| # | Batter | Score | Tier | Odds | Form | Rank | ISO ?Isolated Power — career SLG minus AVG. >.220 elite, .180–.220 above avg, <.140 below avg. | EV ?Avg Exit Velocity (mph) — Statcast season-to-date. >92 elite, 89–92 above avg, <86 below avg. | Barrel% ?Barrel rate vs. this pitch mix — percentage of contact classified as barrels (perfect EV + LA combo). >12% elite, 8–12% above avg. | HR/FB ?Batter HR / Fly Ball rate for this matchup. A vs LHP/vs RHP chip means a handedness split is shown; otherwise the value is overall. | HR Dist ?Average distance (ft) of this batter's HRs. >400ft elite raw power, 380–400 above avg. | Sea HR% ?Season HR rate (HRs / PAs so far this year). v3.5 model feature — top backtest contributor. | 14d Pace ?Recent 14-day HR pace (HRs / games started). v3.5 model feature — captures current form. | Match% ?HR/FB Matchup — combined batter × pitcher HR/FB rate. The headline "how favorable is this matchup" number. | BBE ?Sample size — batted-ball events. <30 = small sample, treat stats with caution. | |
|---|---|---|---|---|---|---|---|---|---|---|---|---|---|---|---|---|
| 1 |

|
Junior Caminero | 56 | 🟠 C | · | 🌤️ WARM | 29 | 0.202 | 93.2 | 10.9% | 32.5% vs RHP | 406 | 20.3% | 16.7% | 18.0% | 31 |
| 2 |

|
Jonathan Aranda | 48 | ⚪ D | · | 🌧️ COOL | 54 | 0.175 | 90.8 | 10.5% | 21.8% vs RHP | 391 | 13.9% | 8.3% | 9.4% | 38 |
| 3 |

|
Yandy Diaz | 40 | ⚪ D | · | ❄ COLD | 77 | 0.178 | 90.6 | 8.8% | 24.2% vs RHP | 385 | 0.0% | 0.0% | 11.2% | 34 |
| 4 |

|
Cedric Mullins | 29 | ⚪ D | · | ❄ COLD | 119 | 0.103 | 88.0 | 5.8% | 14.3% vs RHP | 386 | 8.5% | 0.0% | 6.4% | 20 |
| 5 |

|
Hunter Feduccia | 28 | ⚪ D | · | 🔥 HOT | 123 | 0.062 | 90.7 | 8.3% | 7.7% vs RHP | 421 | 4.3% | 0.0% | 5.8% | 11 |
| 6 |

|
Richie Palacios | 24 | ⚪ D | · | 🌤️ WARM | 131 | 0.080 | 86.6 | 5.8% | 5.0% vs RHP | 382 | 0.0% | 0.0% | 5.5% | 19 |
| 7 |

|
Taylor Walls | 21 | ⚪ D | · | 🌧️ COOL | 138 | 0.070 | 84.1 | 4.8% | 0.0% vs RHP | 0 | 0.0% | 0.0% | 5.0% | 23 |
| 8 |

|
Chandler Simpson | 12 | ⚪ D | · | 🌧️ COOL | 142 | 0.056 | 84.0 | · | 5.0% vs RHP | 0 | 0.0% | 0.0% | 5.5% | 38 |