 PHI
PHI
@
6:45p
 WSH
WSH
Stadium Conditions
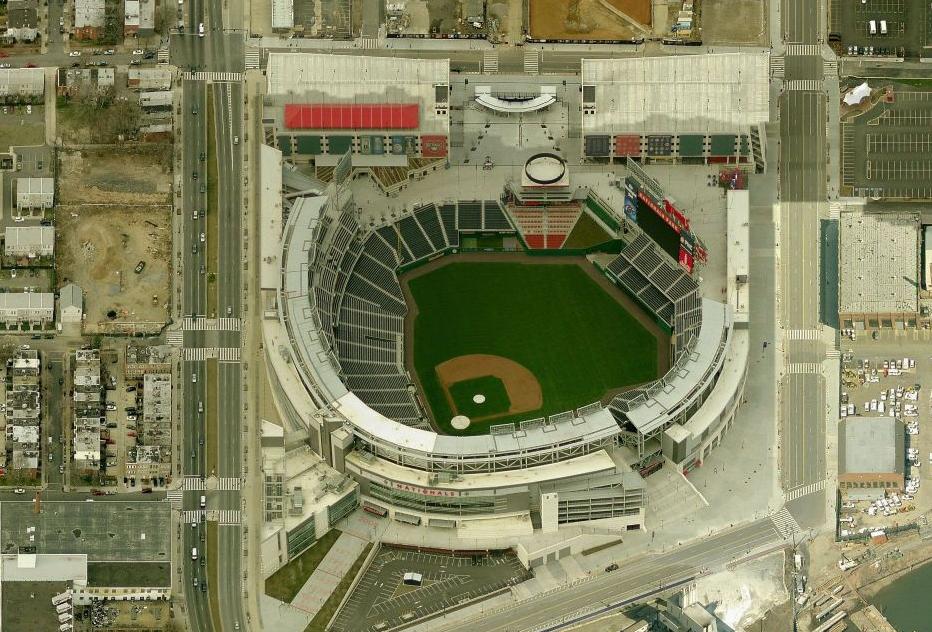
Nationals Park
First pitch 6:45p
· roof open
Park 1.00×
Wind 7 mph in
87°F
open
-4
8 mph · cross
75°F
6:45p
Neutral for HR environment
-4
8 mph · cross
75°F
7:45p
Neutral for HR environment
-4
8 mph · cross
75°F
8:45p
Neutral for HR environment
-4
8 mph · cross
75°F
9:45p
Neutral for HR environment
-4
8 mph · cross
75°F
10:45p
Neutral for HR environment
⚪ Boost · Combined 1.10
87°F, wind 7 mph SW (in) — modifier: +1. Park, wind, temperature, and roof are inputs to Combined, not separate signals to stack on top.

7 batters
| # | Batter | Score | Tier | Odds | Form | Rank | ISO ?Isolated Power — career SLG minus AVG. >.220 elite, .180–.220 above avg, <.140 below avg. | EV ?Avg Exit Velocity (mph) — Statcast season-to-date. >92 elite, 89–92 above avg, <86 below avg. | Barrel% ?Barrel rate vs. this pitch mix — percentage of contact classified as barrels (perfect EV + LA combo). >12% elite, 8–12% above avg. | HR/FB ?Batter HR / Fly Ball rate for this matchup. A vs LHP/vs RHP chip means a handedness split is shown; otherwise the value is overall. | HR Dist ?Average distance (ft) of this batter's HRs. >400ft elite raw power, 380–400 above avg. | Sea HR% ?Season HR rate (HRs / PAs so far this year). v3.5 model feature — top backtest contributor. | 14d Pace ?Recent 14-day HR pace (HRs / games started). v3.5 model feature — captures current form. | Match% ?HR/FB Matchup — combined batter × pitcher HR/FB rate. The headline "how favorable is this matchup" number. | BBE ?Sample size — batted-ball events. <30 = small sample, treat stats with caution. | |
|---|---|---|---|---|---|---|---|---|---|---|---|---|---|---|---|---|
| 1 |

|
Kyle Schwarber | 75 | 🟡 B | +850 | · | 3 | 0.344 | 93.2 | 12.8% | 46.3% vs RHP | 404 | 27.8% | 27.3% | 32.8% | 24 |
| 2 |

|
Bryce Harper | 61 | 🔵 C+ | · | 🌧️ COOL | 17 | 0.246 | 90.4 | 9.7% | 40.0% vs RHP | 401 | 20.0% | 16.7% | 22.0% | 34 |
| 3 |

|
Brandon Marsh | 51 | 🟠 C | · | 🌤️ WARM | 45 | 0.184 | 90.1 | 8.1% | 23.7% vs RHP | 392 | 12.5% | 25.0% | 20.1% | 33 |
| 4 |

|
Bryson Stott | 42 | ⚪ D | · | 🌧️ COOL | 73 | 0.161 | 89.3 | 7.4% | 11.5% vs RHP | 393 | 10.0% | 8.3% | 8.9% | 36 |
| 5 |

|
Alec Bohm | 37 | ⚪ D | · | 🌤️ WARM | 94 | 0.134 | 89.7 | 5.7% | 17.2% vs RHP | 385 | 11.0% | 9.1% | 7.8% | 39 |
| 6 |

|
Trea Turner | 31 | ⚪ D | · | 🌧️ COOL | 116 | 0.102 | 88.8 | 5.9% | 13.6% vs RHP | 394 | 9.5% | 0.0% | 7.3% | 32 |
| 7 |

|
Justin Crawford | 25 | ⚪ D | · | ❄ COLD | 128 | 0.102 | 86.9 | 3.0% | 7.1% vs RHP | 382 | 3.7% | 0.0% | 6.8% | 20 |

9 batters
| # | Batter | Score | Tier | Odds | Form | Rank | ISO ?Isolated Power — career SLG minus AVG. >.220 elite, .180–.220 above avg, <.140 below avg. | EV ?Avg Exit Velocity (mph) — Statcast season-to-date. >92 elite, 89–92 above avg, <86 below avg. | Barrel% ?Barrel rate vs. this pitch mix — percentage of contact classified as barrels (perfect EV + LA combo). >12% elite, 8–12% above avg. | HR/FB ?Batter HR / Fly Ball rate for this matchup. A vs LHP/vs RHP chip means a handedness split is shown; otherwise the value is overall. | HR Dist ?Average distance (ft) of this batter's HRs. >400ft elite raw power, 380–400 above avg. | Sea HR% ?Season HR rate (HRs / PAs so far this year). v3.5 model feature — top backtest contributor. | 14d Pace ?Recent 14-day HR pace (HRs / games started). v3.5 model feature — captures current form. | Match% ?HR/FB Matchup — combined batter × pitcher HR/FB rate. The headline "how favorable is this matchup" number. | BBE ?Sample size — batted-ball events. <30 = small sample, treat stats with caution. | |
|---|---|---|---|---|---|---|---|---|---|---|---|---|---|---|---|---|
| 1 |

|
James Wood | 67 | 🔵 C+ | · | · | 8 | 0.248 | 95.8 | 14.5% | 29.4% vs LHP | 408 | 25.8% | 16.7% | 19.8% | 33 |
| 2 |

|
Curtis Mead | 60 | 🔵 C+ | · | 🌧️ COOL | 21 | 0.229 | 88.6 | 9.8% | 20.0% vs LHP | 399 | 22.0% | 30.0% | 25.0% | 26 |
| 3 |

|
Dylan Crews | 53 | 🟠 C | · | · | 38 | 0.167 | 91.3 | 9.4% | 22.2% vs LHP | 415 | 22.7% | 30.0% | 18.2% | 37 |
| 4 |

|
Keibert Ruiz | 46 | ⚪ D | · | 🌧️ COOL | 60 | 0.193 | 89.3 | 7.0% | 20.0% vs LHP | 378 | 14.8% | 11.1% | 12.5% | 25 |
| 5 |

|
Daylen Lile | 38 | ⚪ D | · | ❄ COLD | 91 | 0.155 | 87.5 | 7.9% | 0.0% vs LHP | 403 | 8.3% | 0.0% | 6.7% | 34 |
| 6 |

|
Jacob Young | 37 | ⚪ D | · | · | 95 | 0.145 | 89.2 | 7.4% | 5.6% vs LHP | 391 | 9.3% | 0.0% | 7.6% | 21 |
| 7 |

|
Jorbit Vivas | 32 | ⚪ D | · | 🔥 HOT | 114 | 0.098 | 83.8 | 6.0% | 5.4% | 387 | 4.9% | 25.0% | 10.7% | 14 |
| 8 |

|
Andres Chaparro | 30 | ⚪ D | · | 🔥 HOT | 118 | 0.093 | 90.2 | 8.4% | 0.0% vs LHP | 0 | 0.0% | 0.0% | 7.7% | 5 |
| 9 |

|
Nasim Nunez | 11 | ⚪ D | · | 🌧️ COOL | 145 | 0.043 | 84.6 | · | 0.0% vs LHP | 0 | 0.0% | 0.0% | 6.1% | 25 |