 TEX
TEX
@
7:07p
 TOR
TOR
Stadium Conditions
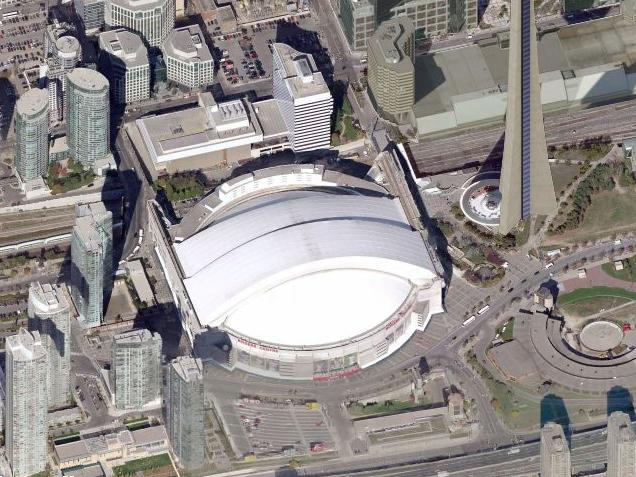
Rogers Centre
First pitch 7:07p
· roof unknown
Park 1.16×
Wind 0 mph dome
—
unknown
Hourly forecast unavailable; showing current stadium conditions only.
⚪ Boost · Combined 1.16
Dome — weather irrelevant. Park, wind, temperature, and roof are inputs to Combined, not separate signals to stack on top.

7 batters
| # | Batter | Score | Tier | Odds | Form | Rank | ISO ?Isolated Power — career SLG minus AVG. >.220 elite, .180–.220 above avg, <.140 below avg. | EV ?Avg Exit Velocity (mph) — Statcast season-to-date. >92 elite, 89–92 above avg, <86 below avg. | Barrel% ?Barrel rate vs. this pitch mix — percentage of contact classified as barrels (perfect EV + LA combo). >12% elite, 8–12% above avg. | HR/FB ?Batter HR / Fly Ball rate for this matchup. A vs LHP/vs RHP chip means a handedness split is shown; otherwise the value is overall. | HR Dist ?Average distance (ft) of this batter's HRs. >400ft elite raw power, 380–400 above avg. | Sea HR% ?Season HR rate (HRs / PAs so far this year). v3.5 model feature — top backtest contributor. | 14d Pace ?Recent 14-day HR pace (HRs / games started). v3.5 model feature — captures current form. | Match% ?HR/FB Matchup — combined batter × pitcher HR/FB rate. The headline "how favorable is this matchup" number. | BBE ?Sample size — batted-ball events. <30 = small sample, treat stats with caution. | |
|---|---|---|---|---|---|---|---|---|---|---|---|---|---|---|---|---|
| 1 |

|
Kazuma Okamoto | 70 | 🟡 B | +540 | 🌧️ COOL | 4 | 0.217 | 92.2 | 11.2% | 26.7% vs LHP | 400 | 18.0% | 33.3% | 29.4% | 26 |
| 2 |

|
George Springer | 54 | 🟠 C | · | · | 33 | 0.169 | 88.3 | 8.2% | 11.8% vs LHP | 392 | 10.0% | 25.0% | 19.1% | 35 |
| 3 |

|
Davis Schneider | 53 | 🟠 C | +900 | 🌤️ WARM | 35 | 0.143 | 88.5 | 10.1% | 11.1% vs LHP | 399 | 5.1% | 28.6% | 16.0% | 19 |
| 4 |

|
Alejandro Kirk | 43 | ⚪ D | +900 | 🌧️ COOL | 70 | 0.180 | 85.5 | 4.8% | 15.4% | 394 | 5.3% | 0.0% | 12.7% | 22 |
| 5 |

|
Ernie Clement | 40 | ⚪ D | · | ❄ COLD | 78 | 0.143 | 85.3 | 4.8% | 13.6% vs LHP | 374 | 9.6% | 0.0% | 9.8% | 28 |
| 6 |

|
Nathan Lukes | 34 | ⚪ D | · | ❄ COLD | 106 | 0.096 | 86.3 | 2.6% | 6.7% | 383 | 5.1% | 20.0% | 9.8% | 30 |
| 7 |

|
Myles Straw | 32 | ⚪ D | · | ❄ COLD | 110 | 0.086 | 86.1 | 5.7% | 5.0% vs LHP | 389 | 0.0% | 0.0% | 7.8% | 17 |

9 batters
| # | Batter | Score | Tier | Odds | Form | Rank | ISO ?Isolated Power — career SLG minus AVG. >.220 elite, .180–.220 above avg, <.140 below avg. | EV ?Avg Exit Velocity (mph) — Statcast season-to-date. >92 elite, 89–92 above avg, <86 below avg. | Barrel% ?Barrel rate vs. this pitch mix — percentage of contact classified as barrels (perfect EV + LA combo). >12% elite, 8–12% above avg. | HR/FB ?Batter HR / Fly Ball rate for this matchup. A vs LHP/vs RHP chip means a handedness split is shown; otherwise the value is overall. | HR Dist ?Average distance (ft) of this batter's HRs. >400ft elite raw power, 380–400 above avg. | Sea HR% ?Season HR rate (HRs / PAs so far this year). v3.5 model feature — top backtest contributor. | 14d Pace ?Recent 14-day HR pace (HRs / games started). v3.5 model feature — captures current form. | Match% ?HR/FB Matchup — combined batter × pitcher HR/FB rate. The headline "how favorable is this matchup" number. | BBE ?Sample size — batted-ball events. <30 = small sample, treat stats with caution. | |
|---|---|---|---|---|---|---|---|---|---|---|---|---|---|---|---|---|
| 1 |

|
Corey Seager | 65 | 🔵 C+ | +900 | 🌤️ WARM | 9 | 0.188 | 91.2 | 11.0% | 25.0% vs RHP | 394 | 17.0% | 100.0% | 18.3% | 4 |
| 2 |

|
Joc Pederson | 64 | 🔵 C+ | · | 🌤️ WARM | 11 | 0.206 | 91.6 | 9.0% | 24.4% vs RHP | 386 | 16.4% | 30.0% | 26.9% | 30 |
| 3 |

|
Wyatt Langford | 60 | 🔵 C+ | · | 🌤️ WARM | 19 | 0.186 | 89.2 | 7.5% | 18.5% vs RHP | 394 | 14.0% | 41.7% | 26.2% | 43 |
| 4 |

|
Jake Burger | 59 | 🟠 C | · | · | 22 | 0.195 | 90.3 | 8.7% | 25.6% vs RHP | 397 | 14.1% | 16.7% | 25.5% | 28 |
| 5 |

|
Brandon Nimmo | 53 | 🟠 C | · | 🔥 HOT | 36 | 0.169 | 92.6 | 9.6% | 14.0% vs RHP | 411 | 9.6% | 8.3% | 11.5% | 41 |
| 6 |

|
Kyle Higashioka | 51 | 🟠 C | · | 🌧️ COOL | 44 | 0.153 | 88.0 | 8.9% | 15.0% vs RHP | 397 | 9.7% | 14.3% | 16.4% | 15 |
| 7 |

|
Ezequiel Duran | 49 | ⚪ D | · | ❄ COLD | 49 | 0.158 | 89.3 | 6.8% | 16.7% vs RHP | 377 | 10.5% | 16.7% | 15.3% | 34 |
| 8 |

|
Nicky Lopez | 22 | ⚪ D | · | 🌧️ COOL | 134 | 0.055 | 84.5 | · | 10.0% vs RHP | 397 | 5.3% | 0.0% | 8.4% | 34 |
| 9 |

|
Alejandro Osuna | 19 | ⚪ D | · | · | 139 | 0.034 | 88.1 | · | 0.0% vs RHP | 0 | 0.0% | 0.0% | 7.0% | 22 |