 ATH
ATH
@
6:45p
 SF
SF
Stadium Conditions
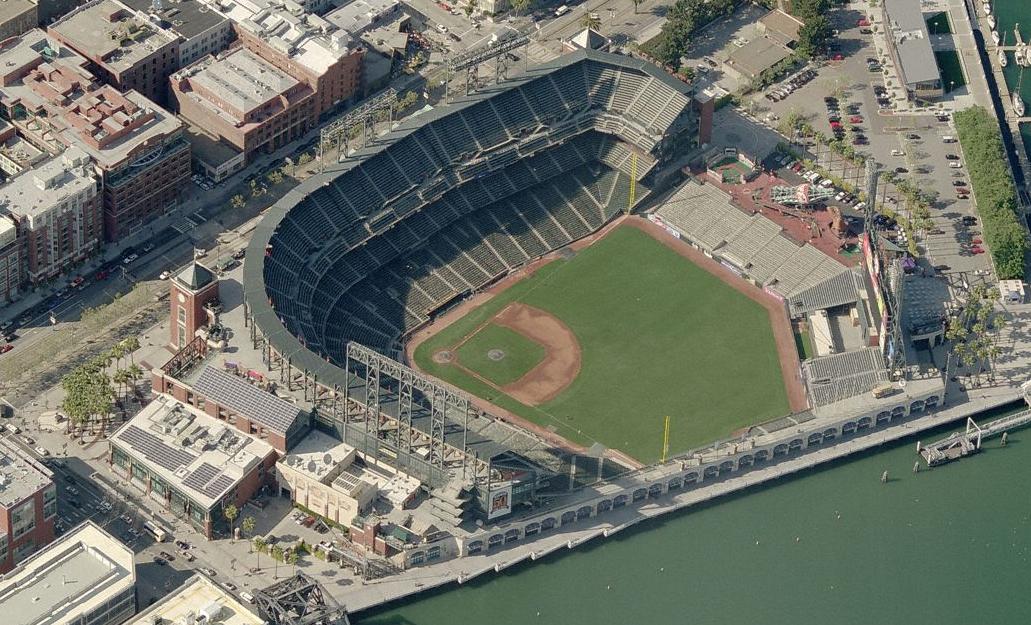
Oracle Park
First pitch 6:45p
· roof open
Park 0.84×
Wind 10 mph slight_out
65°F
open
+2
9 mph · out
59°F
6:45p
Neutral for HR environment
+2
9 mph · out
59°F
7:45p
Neutral for HR environment
+2
9 mph · out
59°F
8:45p
Neutral for HR environment
+2
9 mph · out
59°F
9:45p
Neutral for HR environment
+2
9 mph · out
59°F
10:45p
Neutral for HR environment
⚪ Soft suppress · Combined 0.93
65°F, wind 10 mph WNW (slight_out) — modifier: +1. Park, wind, temperature, and roof are inputs to Combined, not separate signals to stack on top.

8 batters
| # | Batter | Score | Tier | Odds | Form | Rank | ISO ?Isolated Power — career SLG minus AVG. >.220 elite, .180–.220 above avg, <.140 below avg. | EV ?Avg Exit Velocity (mph) — Statcast season-to-date. >92 elite, 89–92 above avg, <86 below avg. | Barrel% ?Barrel rate vs. this pitch mix — percentage of contact classified as barrels (perfect EV + LA combo). >12% elite, 8–12% above avg. | HR/FB ?Batter HR / Fly Ball rate for this matchup. A vs LHP/vs RHP chip means a handedness split is shown; otherwise the value is overall. | HR Dist ?Average distance (ft) of this batter's HRs. >400ft elite raw power, 380–400 above avg. | Sea HR% ?Season HR rate (HRs / PAs so far this year). v3.5 model feature — top backtest contributor. | 14d Pace ?Recent 14-day HR pace (HRs / games started). v3.5 model feature — captures current form. | Match% ?HR/FB Matchup — combined batter × pitcher HR/FB rate. The headline "how favorable is this matchup" number. | BBE ?Sample size — batted-ball events. <30 = small sample, treat stats with caution. | |
|---|---|---|---|---|---|---|---|---|---|---|---|---|---|---|---|---|
| 1 |

|
Nick Kurtz | 68 | 🔵 C+ | +350 | · | 15 | 0.258 | 94.3 | 12.3% | 43.3% vs RHP | 410 | 23.0% | 25.0% | 28.8% | 27 |
| 2 |

|
Shea Langeliers | 63 | 🔵 C+ | +350 | · | 26 | 0.256 | 91.4 | 11.0% | 22.6% vs RHP | 416 | 21.4% | 20.0% | 20.9% | 34 |
| 3 |

|
Zack Gelof | 55 | 🟠 C | · | 🌤️ WARM | 56 | 0.216 | 89.3 | 7.7% | 26.7% vs RHP | 392 | 22.6% | 25.0% | 27.3% | 31 |
| 4 |

|
Tyler Soderstrom | 55 | 🟠 C | +500 | 🌧️ COOL | 57 | 0.239 | 89.9 | 9.3% | 17.8% vs RHP | 403 | 15.1% | 16.7% | 15.9% | 33 |
| 5 |

|
Carlos Cortes | 39 | ⚪ D | · | 🌧️ COOL | 172 | 0.155 | 89.7 | 8.2% | 16.2% vs RHP | 404 | 5.5% | 9.1% | 8.2% | 21 |
| 6 |

|
Lawrence Butler | 37 | ⚪ D | +750 | 🌤️ WARM | 184 | 0.121 | 88.3 | 7.5% | 26.1% vs RHP | 402 | 4.8% | 18.2% | 13.2% | 21 |
| 7 |

|
Jacob Wilson | 27 | ⚪ D | +950 | 🌤️ WARM | 229 | 0.108 | 84.2 | 3.8% | 11.5% vs RHP | 375 | 5.3% | 11.1% | 8.1% | 34 |
| 8 |

|
Jeff Mcneil | 23 | ⚪ D | +950 | ❄ COLD | 239 | 0.084 | 85.9 | 2.9% | 10.0% vs RHP | 373 | 6.7% | 10.0% | 6.4% | 21 |

7 batters
| # | Batter | Score | Tier | Odds | Form | Rank | ISO ?Isolated Power — career SLG minus AVG. >.220 elite, .180–.220 above avg, <.140 below avg. | EV ?Avg Exit Velocity (mph) — Statcast season-to-date. >92 elite, 89–92 above avg, <86 below avg. | Barrel% ?Barrel rate vs. this pitch mix — percentage of contact classified as barrels (perfect EV + LA combo). >12% elite, 8–12% above avg. | HR/FB ?Batter HR / Fly Ball rate for this matchup. A vs LHP/vs RHP chip means a handedness split is shown; otherwise the value is overall. | HR Dist ?Average distance (ft) of this batter's HRs. >400ft elite raw power, 380–400 above avg. | Sea HR% ?Season HR rate (HRs / PAs so far this year). v3.5 model feature — top backtest contributor. | 14d Pace ?Recent 14-day HR pace (HRs / games started). v3.5 model feature — captures current form. | Match% ?HR/FB Matchup — combined batter × pitcher HR/FB rate. The headline "how favorable is this matchup" number. | BBE ?Sample size — batted-ball events. <30 = small sample, treat stats with caution. | |
|---|---|---|---|---|---|---|---|---|---|---|---|---|---|---|---|---|
| 1 |

|
Casey Schmitt | 42 | ⚪ D | +475 | · | 144 | 0.233 | 89.4 | 5.7% | 16.7% vs LHP | 394 | 17.6% | 8.3% | 9.3% | 33 |
| 2 |

|
Rafael Devers | 38 | ⚪ D | +525 | · | 175 | 0.193 | 91.8 | 4.9% | 13.6% vs LHP | 402 | 12.5% | 16.7% | 12.5% | 28 |
| 3 |

|
Willy Adames | 38 | ⚪ D | +525 | 🌧️ COOL | 176 | 0.200 | 88.6 | 4.8% | 10.0% vs LHP | 389 | 14.9% | 18.2% | 10.5% | 28 |
| 4 |

|
Matt Chapman | 30 | ⚪ D | +525 | 🔥 HOT | 218 | 0.154 | 88.3 | 4.2% | 18.2% vs LHP | 398 | 6.7% | 16.7% | 10.6% | 24 |
| 5 |

|
Jung Hoo Lee | 23 | ⚪ D | · | 🌤️ WARM | 238 | 0.137 | 87.8 | 2.7% | 14.3% vs LHP | 378 | 5.9% | 8.3% | 6.1% | 35 |
| 6 |

|
Drew Gilbert | 19 | ⚪ D | · | 🌧️ COOL | 245 | 0.128 | 85.3 | 2.5% | 7.7% | 393 | 2.8% | 0.0% | 4.6% | 22 |
| 7 |

|
Luis Arraez | 15 | ⚪ D | · | ❄ COLD | 250 | 0.122 | 87.2 | 0.9% | 5.0% vs LHP | 357 | 0.0% | 0.0% | 4.4% | 42 |