 CLE
CLE
@
2:10p
 CWS
CWS
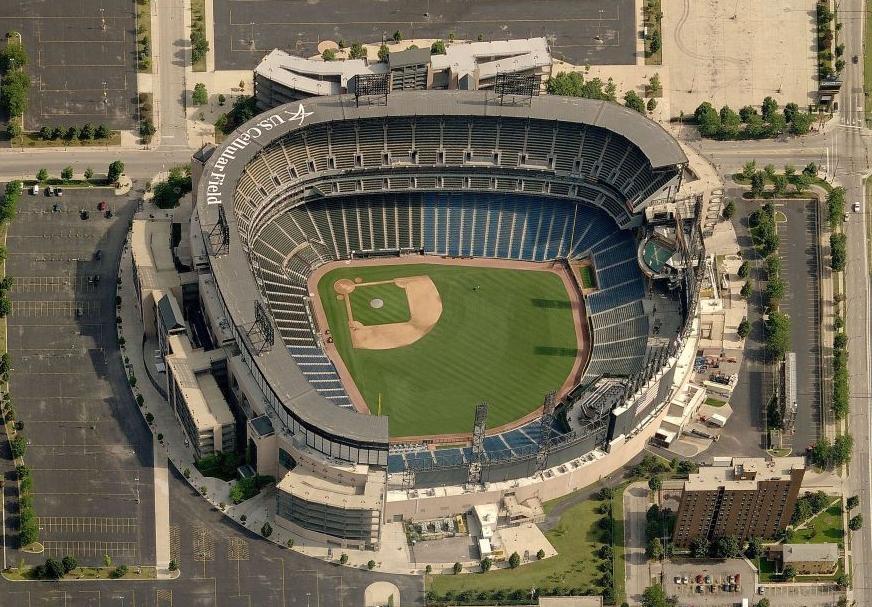
Stadium Conditions
Rate Field
First pitch 2:10p
· roof unknown
Park 0.92×
Wind unknown
—
unknown
Hourly forecast unavailable; showing current stadium conditions only.
⚪ Soft suppress · Combined 0.92
Unknown stadium. Park, wind, temperature, and roof are inputs to Combined, not separate signals to stack on top.

7 batters
| # | Batter | Score | Tier | Odds | Form | Rank | ISO ?Isolated Power — career SLG minus AVG. >.220 elite, .180–.220 above avg, <.140 below avg. | EV ?Avg Exit Velocity (mph) — Statcast season-to-date. >92 elite, 89–92 above avg, <86 below avg. | Barrel% ?Barrel rate vs. this pitch mix — percentage of contact classified as barrels (perfect EV + LA combo). >12% elite, 8–12% above avg. | HR/FB ?Batter HR / Fly Ball rate for this matchup. A vs LHP/vs RHP chip means a handedness split is shown; otherwise the value is overall. | HR Dist ?Average distance (ft) of this batter's HRs. >400ft elite raw power, 380–400 above avg. | Sea HR% ?Season HR rate (HRs / PAs so far this year). v3.5 model feature — top backtest contributor. | 14d Pace ?Recent 14-day HR pace (HRs / games started). v3.5 model feature — captures current form. | Match% ?HR/FB Matchup — combined batter × pitcher HR/FB rate. The headline "how favorable is this matchup" number. | BBE ?Sample size — batted-ball events. <30 = small sample, treat stats with caution. | |
|---|---|---|---|---|---|---|---|---|---|---|---|---|---|---|---|---|
| 1 |

|
Colson Montgomery | 70 | 🟡 B | · | 🌤️ WARM | 12 | 0.259 | 90.0 | 12.4% | 28.3% vs RHP | 396 | 27.6% | 25.0% | 31.2% | 22 |
| 2 |

|
Miguel Vargas | 60 | 🔵 C+ | · | · | 40 | 0.219 | 90.0 | 12.6% | 15.2% vs RHP | 390 | 21.3% | 8.3% | 12.7% | 35 |
| 3 |

|
Andrew Benintendi | 57 | 🟠 C | · | 🌤️ WARM | 51 | 0.187 | 89.6 | 10.8% | 18.4% vs RHP | 393 | 16.3% | 28.6% | 21.3% | 21 |
| 4 |

|
Sam Antonacci | 45 | ⚪ D | · | 🌤️ WARM | 117 | 0.132 | 88.1 | 9.1% | 12.9% vs RHP | 410 | 8.1% | 27.3% | 14.0% | 29 |
| 5 |

|
Tristan Peters | 40 | ⚪ D | · | 🌧️ COOL | 157 | 0.159 | 86.3 | 6.9% | 7.9% vs RHP | 371 | 5.8% | 10.0% | 9.2% | 24 |
| 6 |

|
Chase Meidroth | 36 | ⚪ D | · | 🌧️ COOL | 189 | 0.121 | 87.7 | 7.1% | 12.5% vs RHP | 381 | 6.5% | 8.3% | 7.3% | 26 |
| 7 |

|
Jacob Gonzalez | 24 | ⚪ D | · | 🌧️ COOL | 236 | 0.059 | 88.4 | 5.7% | 14.3% vs RHP | 428 | 0.0% | 0.0% | 8.4% | 17 |

8 batters
| # | Batter | Score | Tier | Odds | Form | Rank | ISO ?Isolated Power — career SLG minus AVG. >.220 elite, .180–.220 above avg, <.140 below avg. | EV ?Avg Exit Velocity (mph) — Statcast season-to-date. >92 elite, 89–92 above avg, <86 below avg. | Barrel% ?Barrel rate vs. this pitch mix — percentage of contact classified as barrels (perfect EV + LA combo). >12% elite, 8–12% above avg. | HR/FB ?Batter HR / Fly Ball rate for this matchup. A vs LHP/vs RHP chip means a handedness split is shown; otherwise the value is overall. | HR Dist ?Average distance (ft) of this batter's HRs. >400ft elite raw power, 380–400 above avg. | Sea HR% ?Season HR rate (HRs / PAs so far this year). v3.5 model feature — top backtest contributor. | 14d Pace ?Recent 14-day HR pace (HRs / games started). v3.5 model feature — captures current form. | Match% ?HR/FB Matchup — combined batter × pitcher HR/FB rate. The headline "how favorable is this matchup" number. | BBE ?Sample size — batted-ball events. <30 = small sample, treat stats with caution. | |
|---|---|---|---|---|---|---|---|---|---|---|---|---|---|---|---|---|
| 1 |

|
Travis Bazzana | 54 | 🟠 C | · | 🌤️ WARM | 61 | 0.223 | 88.7 | 6.4% | 22.6% vs RHP | 395 | 14.3% | 16.7% | 21.2% | 30 |
| 2 |

|
Kyle Manzardo | 53 | 🟠 C | · | · | 70 | 0.173 | 89.0 | 10.1% | 24.3% vs RHP | 388 | 11.6% | 20.0% | 16.8% | 23 |
| 3 |

|
Rhys Hoskins | 50 | 🟠 C | · | 🌧️ COOL | 86 | 0.182 | 88.1 | 9.4% | 22.2% vs RHP | 378 | 11.5% | 9.1% | 13.8% | 25 |
| 4 |

|
David Fry | 44 | ⚪ D | · | ❄ COLD | 123 | 0.151 | 85.6 | 7.1% | 18.2% vs RHP | 377 | 7.7% | 16.7% | 18.4% | 12 |
| 5 |

|
Daniel Schneemann | 43 | ⚪ D | · | 🌤️ WARM | 131 | 0.145 | 87.6 | 7.5% | 14.7% vs RHP | 398 | 7.7% | 14.3% | 12.5% | 17 |
| 6 |

|
Brayan Rocchio | 33 | ⚪ D | · | 🌧️ COOL | 206 | 0.129 | 86.5 | 4.7% | 11.8% vs RHP | 382 | 5.5% | 0.0% | 6.4% | 34 |
| 7 |

|
Patrick Bailey | 31 | ⚪ D | · | 🌧️ COOL | 214 | 0.073 | 89.8 | 7.4% | 4.8% vs RHP | 407 | 3.3% | 0.0% | 5.7% | 10 |
| 8 |

|
Steven Kwan | 18 | ⚪ D | · | 🌤️ WARM | 246 | 0.044 | 83.3 | 2.0% | 2.4% vs RHP | 381 | 1.4% | 0.0% | 5.5% | 21 |