 HOU
HOU
@
7:07p
 TOR
TOR
Stadium Conditions
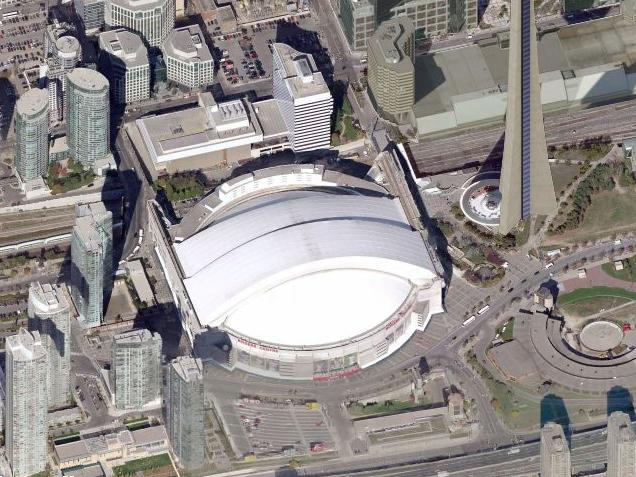
Rogers Centre
First pitch 7:07p
· roof unknown
Park 1.18×
Wind 0 mph dome
—
unknown
Hourly forecast unavailable; showing current stadium conditions only.
⚪ Boost · Combined 1.18
Dome — weather irrelevant. Park, wind, temperature, and roof are inputs to Combined, not separate signals to stack on top.

7 batters
| # | Batter | Score | Tier | Odds | Form | Rank | ISO ?Isolated Power — career SLG minus AVG. >.220 elite, .180–.220 above avg, <.140 below avg. | EV ?Avg Exit Velocity (mph) — Statcast season-to-date. >92 elite, 89–92 above avg, <86 below avg. | Barrel% ?Barrel rate vs. this pitch mix — percentage of contact classified as barrels (perfect EV + LA combo). >12% elite, 8–12% above avg. | HR/FB ?Batter HR / Fly Ball rate for this matchup. A vs LHP/vs RHP chip means a handedness split is shown; otherwise the value is overall. | HR Dist ?Average distance (ft) of this batter's HRs. >400ft elite raw power, 380–400 above avg. | Sea HR% ?Season HR rate (HRs / PAs so far this year). v3.5 model feature — top backtest contributor. | 14d Pace ?Recent 14-day HR pace (HRs / games started). v3.5 model feature — captures current form. | Match% ?HR/FB Matchup — combined batter × pitcher HR/FB rate. The headline "how favorable is this matchup" number. | BBE ?Sample size — batted-ball events. <30 = small sample, treat stats with caution. | |
|---|---|---|---|---|---|---|---|---|---|---|---|---|---|---|---|---|
| 1 |

|
Kazuma Okamoto | 76 | 🟡 B | +625 | · | 2 | 0.221 | 92.2 | 11.4% | 30.9% vs RHP | 400 | 18.3% | 33.3% | 33.2% | 26 |
| 2 |

|
George Springer | 61 | 🔵 C+ | · | · | 32 | 0.173 | 88.3 | 8.3% | 21.9% vs RHP | 392 | 10.1% | 25.0% | 23.6% | 35 |
| 3 |

|
Daulton Varsho | 60 | 🔵 C+ | +850 | 🔥 HOT | 37 | 0.154 | 86.2 | 8.0% | 14.3% vs RHP | 386 | 9.8% | 50.0% | 22.7% | 10 |
| 4 |

|
Davis Schneider | 60 | 🔵 C+ | · | 🌤️ WARM | 39 | 0.145 | 88.5 | 10.3% | 14.3% vs RHP | 399 | 5.3% | 33.3% | 18.0% | 17 |
| 5 |

|
Alejandro Kirk | 49 | ⚪ D | · | 🌧️ COOL | 91 | 0.180 | 85.5 | 4.9% | 22.2% vs RHP | 394 | 5.6% | 0.0% | 14.6% | 19 |
| 6 |

|
Andres Gimenez | 44 | ⚪ D | · | 🌤️ WARM | 122 | 0.139 | 86.5 | 5.9% | 14.3% vs RHP | 391 | 0.0% | 0.0% | 12.1% | 27 |
| 7 |

|
Nathan Lukes | 37 | ⚪ D | · | ❄ COLD | 181 | 0.098 | 86.3 | 2.6% | 10.0% vs RHP | 383 | 3.4% | 10.0% | 10.7% | 28 |

8 batters
| # | Batter | Score | Tier | Odds | Form | Rank | ISO ?Isolated Power — career SLG minus AVG. >.220 elite, .180–.220 above avg, <.140 below avg. | EV ?Avg Exit Velocity (mph) — Statcast season-to-date. >92 elite, 89–92 above avg, <86 below avg. | Barrel% ?Barrel rate vs. this pitch mix — percentage of contact classified as barrels (perfect EV + LA combo). >12% elite, 8–12% above avg. | HR/FB ?Batter HR / Fly Ball rate for this matchup. A vs LHP/vs RHP chip means a handedness split is shown; otherwise the value is overall. | HR Dist ?Average distance (ft) of this batter's HRs. >400ft elite raw power, 380–400 above avg. | Sea HR% ?Season HR rate (HRs / PAs so far this year). v3.5 model feature — top backtest contributor. | 14d Pace ?Recent 14-day HR pace (HRs / games started). v3.5 model feature — captures current form. | Match% ?HR/FB Matchup — combined batter × pitcher HR/FB rate. The headline "how favorable is this matchup" number. | BBE ?Sample size — batted-ball events. <30 = small sample, treat stats with caution. | |
|---|---|---|---|---|---|---|---|---|---|---|---|---|---|---|---|---|
| 1 |

|
Yordan Alvarez | 72 | 🟡 B | +575 | 🌧️ COOL | 6 | 0.311 | 94.5 | 9.5% | 27.4% vs RHP | 400 | 27.3% | 0.0% | 27.9% | 40 |
| 2 |

|
Brice Matthews | 49 | ⚪ D | · | 🌤️ WARM | 89 | 0.139 | 88.1 | 6.7% | 11.1% vs RHP | 410 | 10.5% | 25.0% | 17.8% | 18 |
| 3 |

|
Jeremy Peña | 48 | ⚪ D | · | 🌤️ WARM | 93 | 0.167 | 86.9 | 4.6% | 16.1% vs RHP | 388 | 9.4% | 18.2% | 23.0% | 33 |
| 4 |

|
Cam Smith | 48 | ⚪ D | · | · | 97 | 0.133 | 89.6 | 7.6% | 15.6% vs RHP | 418 | 11.0% | 18.2% | 12.5% | 35 |
| 5 |

|
Isaac Paredes | 47 | ⚪ D | · | · | 102 | 0.168 | 87.1 | 5.6% | 20.0% vs RHP | 367 | 10.7% | 9.1% | 14.4% | 31 |
| 6 |

|
Jose Altuve | 45 | ⚪ D | · | 🌤️ WARM | 114 | 0.158 | 85.9 | 5.8% | 26.9% vs RHP | 376 | 6.7% | 0.0% | 24.7% | 32 |
| 7 |

|
Yainer Diaz | 41 | ⚪ D | · | 🌤️ WARM | 147 | 0.111 | 87.7 | 4.9% | 11.8% vs RHP | 383 | 6.2% | 20.0% | 14.6% | 14 |
| 8 |

|
Joey Loperfido | 32 | ⚪ D | · | 🌤️ WARM | 210 | 0.078 | 89.6 | 5.6% | 0.0% vs RHP | 379 | 0.0% | 0.0% | 6.6% | 21 |