 WSH
WSH
@
7:05p
 BAL
BAL
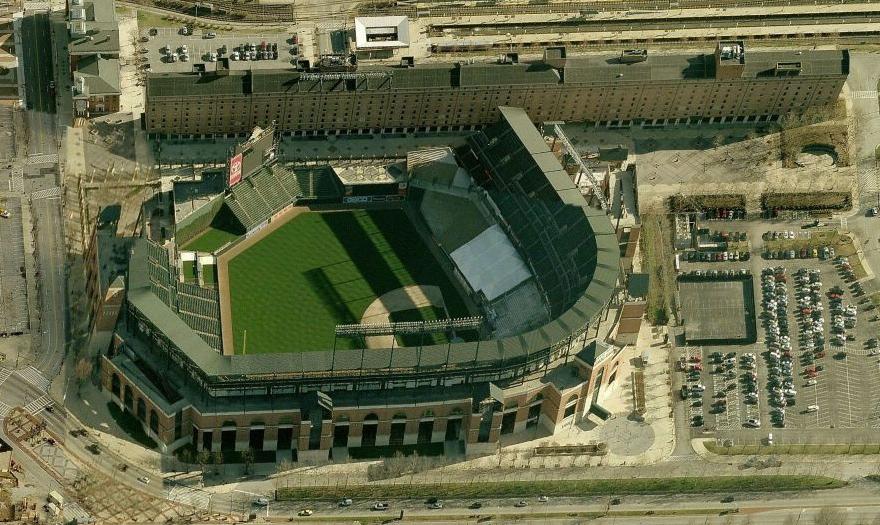
Stadium Conditions
Camden Yards
First pitch 7:05p
· roof open
Park 1.30×
Wind 4 mph out
87°F
open
+8
3 mph · cross
73°F
7:05p
Boost for HR environment
+8
3 mph · cross
73°F
8:05p
Boost for HR environment
+8
3 mph · cross
73°F
9:05p
Boost for HR environment
+8
3 mph · cross
73°F
10:05p
Boost for HR environment
+8
3 mph · cross
73°F
11:05p
Boost for HR environment
⚪ Boost · Combined 1.56
87°F, wind 4 mph W (out) — modifier: +2. Park, wind, temperature, and roof are inputs to Combined, not separate signals to stack on top.

9 batters
| # | Batter | Score | Tier | Odds | Form | Rank | ISO ?Isolated Power — career SLG minus AVG. >.220 elite, .180–.220 above avg, <.140 below avg. | EV ?Avg Exit Velocity (mph) — Statcast season-to-date. >92 elite, 89–92 above avg, <86 below avg. | Barrel% ?Barrel rate vs. this pitch mix — percentage of contact classified as barrels (perfect EV + LA combo). >12% elite, 8–12% above avg. | HR/FB ?Batter HR / Fly Ball rate for this matchup. A vs LHP/vs RHP chip means a handedness split is shown; otherwise the value is overall. | HR Dist ?Average distance (ft) of this batter's HRs. >400ft elite raw power, 380–400 above avg. | Sea HR% ?Season HR rate (HRs / PAs so far this year). v3.5 model feature — top backtest contributor. | 14d Pace ?Recent 14-day HR pace (HRs / games started). v3.5 model feature — captures current form. | Match% ?HR/FB Matchup — combined batter × pitcher HR/FB rate. The headline "how favorable is this matchup" number. | BBE ?Sample size — batted-ball events. <30 = small sample, treat stats with caution. | |
|---|---|---|---|---|---|---|---|---|---|---|---|---|---|---|---|---|
| 1 |

|
James Wood | 74 | 🟡 B | +950 | ❄ COLD | 7 | 0.244 | 95.5 | 12.6% | 29.4% vs LHP | 408 | 25.4% | 15.4% | 23.3% | 36 |
| 2 |

|
Curtis Mead | 72 | 🟡 B | · | 🌧️ COOL | 9 | 0.242 | 88.8 | 8.9% | 20.0% vs LHP | 400 | 23.8% | 36.4% | 35.7% | 30 |
| 3 |

|
Dylan Crews | 59 | 🟠 C | · | · | 41 | 0.161 | 91.1 | 8.0% | 22.2% vs LHP | 415 | 21.7% | 27.3% | 21.9% | 40 |
| 4 |

|
Cj Abrams | 58 | 🟠 C | · | 🌧️ COOL | 46 | 0.238 | 90.0 | 8.3% | 16.7% vs LHP | 389 | 0.0% | 0.0% | 29.6% | 34 |
| 5 |

|
Keibert Ruiz | 54 | 🟠 C | · | 🌧️ COOL | 70 | 0.193 | 89.3 | 6.1% | 20.0% vs LHP | 378 | 14.3% | 10.0% | 16.9% | 27 |
| 6 |

|
Daylen Lile | 46 | ⚪ D | · | ❄ COLD | 117 | 0.153 | 87.5 | 6.9% | 0.0% vs LHP | 403 | 8.2% | 0.0% | 8.5% | 37 |
| 7 |

|
Jacob Young | 45 | ⚪ D | · | · | 123 | 0.145 | 89.1 | 6.5% | 5.6% vs LHP | 391 | 9.1% | 0.0% | 10.2% | 24 |
| 8 |

|
Andres Chaparro | 40 | ⚪ D | +900 | 🌤️ WARM | 148 | 0.093 | 89.6 | 8.7% | 0.0% vs LHP | 0 | 0.0% | 0.0% | 10.3% | 7 |
| 9 |

|
Nasim Nunez | 21 | ⚪ D | · | · | 236 | 0.043 | 84.8 | · | 0.0% vs LHP | 0 | 0.0% | 0.0% | 8.3% | 26 |

9 batters
| # | Batter | Score | Tier | Odds | Form | Rank | ISO ?Isolated Power — career SLG minus AVG. >.220 elite, .180–.220 above avg, <.140 below avg. | EV ?Avg Exit Velocity (mph) — Statcast season-to-date. >92 elite, 89–92 above avg, <86 below avg. | Barrel% ?Barrel rate vs. this pitch mix — percentage of contact classified as barrels (perfect EV + LA combo). >12% elite, 8–12% above avg. | HR/FB ?Batter HR / Fly Ball rate for this matchup. A vs LHP/vs RHP chip means a handedness split is shown; otherwise the value is overall. | HR Dist ?Average distance (ft) of this batter's HRs. >400ft elite raw power, 380–400 above avg. | Sea HR% ?Season HR rate (HRs / PAs so far this year). v3.5 model feature — top backtest contributor. | 14d Pace ?Recent 14-day HR pace (HRs / games started). v3.5 model feature — captures current form. | Match% ?HR/FB Matchup — combined batter × pitcher HR/FB rate. The headline "how favorable is this matchup" number. | BBE ?Sample size — batted-ball events. <30 = small sample, treat stats with caution. | |
|---|---|---|---|---|---|---|---|---|---|---|---|---|---|---|---|---|
| 1 |

|
Pete Alonso ⚡ | 64 | 🔵 C+ | +900 | 🌧️ COOL | 22 | 0.219 | 94.2 | 8.3% | 12.5% vs LHP | 397 | 20.0% | 25.0% | 30.5% | 27 |
| 2 |

|
Gunnar Henderson | 60 | 🔵 C+ | · | 🌤️ WARM | 36 | 0.203 | 89.5 | 7.0% | 53.8% vs LHP | 388 | 19.2% | 25.0% | 37.9% | 37 |
| 3 |

|
Samuel Basallo | 59 | 🟠 C | · | 🌧️ COOL | 45 | 0.206 | 91.3 | 8.4% | 16.7% vs LHP | 401 | 14.0% | 16.7% | 28.2% | 30 |
| 4 |

|
Coby Mayo | 54 | 🟠 C | · | 🌧️ COOL | 68 | 0.178 | 91.5 | 7.6% | 43.8% vs LHP | 403 | 15.4% | 11.1% | 29.4% | 14 |
| 5 |

|
Jackson Holliday | 50 | 🟠 C | · | 🌤️ WARM | 88 | 0.186 | 89.7 | 8.9% | 16.7% | 383 | 3.4% | 0.0% | 20.3% | 15 |
| 6 |

|
Blaze Alexander | 42 | ⚪ D | · | 🌤️ WARM | 139 | 0.128 | 92.3 | 6.5% | 8.3% vs LHP | 392 | 6.1% | 14.3% | 10.2% | 26 |
| 7 |

|
Taylor Ward | 38 | ⚪ D | · | 🌤️ WARM | 160 | 0.107 | 89.7 | 5.5% | 11.8% vs LHP | 393 | 6.2% | 16.7% | 11.1% | 39 |
| 8 |

|
Tyler O'Neill | 34 | ⚪ D | · | 🌤️ WARM | 185 | 0.087 | 88.8 | 5.7% | 0.0% vs LHP | 397 | 7.7% | 0.0% | 8.6% | 10 |
| 9 |

|
Leody Taveras | 34 | ⚪ D | · | · | 186 | 0.129 | 87.5 | 4.9% | 0.0% vs LHP | 409 | 0.0% | 0.0% | 8.6% | 26 |