 LAD
LAD
@
6:40p
 MIN
MIN
Stadium Conditions
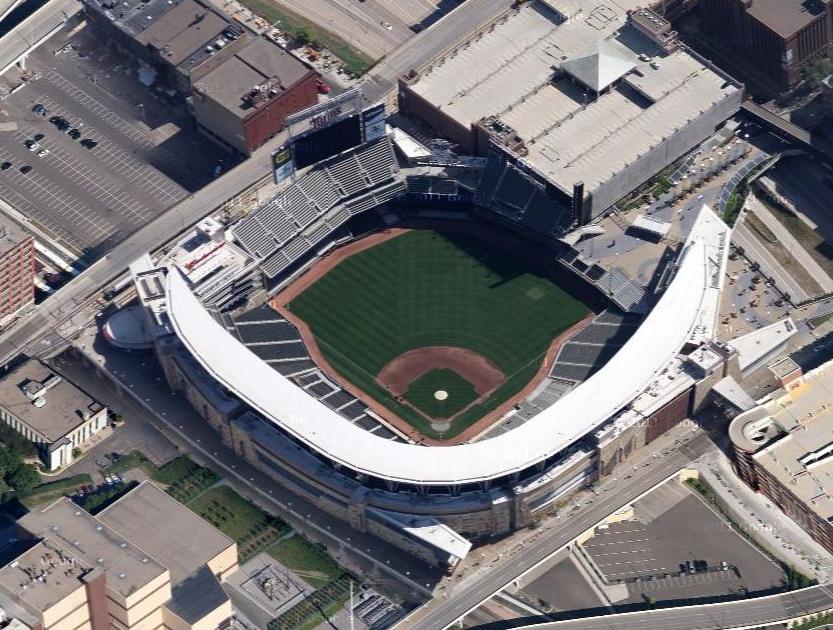
Target Field
First pitch 6:40p
· roof open
Park 1.06×
Wind 5 mph out
74°F
open
-5
6 mph · in
66°F
6:40p
Suppress for HR environment
-5
6 mph · in
66°F
7:40p
Suppress for HR environment
-5
6 mph · in
66°F
8:40p
Suppress for HR environment
-5
6 mph · in
66°F
9:40p
Suppress for HR environment
-5
6 mph · in
66°F
10:40p
Suppress for HR environment
⚪ Elevated · Combined 1.06
74°F, wind 5 mph W (out) — modifier: +0. Park, wind, temperature, and roof are inputs to Combined, not separate signals to stack on top.

9 batters
| # | Batter | Score | Tier | Odds | Form | Rank | ISO ?Isolated Power — career SLG minus AVG. >.220 elite, .180–.220 above avg, <.140 below avg. | EV ?Avg Exit Velocity (mph) — Statcast season-to-date. >92 elite, 89–92 above avg, <86 below avg. | Barrel% ?Barrel rate vs. this pitch mix — percentage of contact classified as barrels (perfect EV + LA combo). >12% elite, 8–12% above avg. | HR/FB ?Batter HR / Fly Ball rate for this matchup. A vs LHP/vs RHP chip means a handedness split is shown; otherwise the value is overall. | HR Dist ?Average distance (ft) of this batter's HRs. >400ft elite raw power, 380–400 above avg. | Sea HR% ?Season HR rate (HRs / PAs so far this year). v3.5 model feature — top backtest contributor. | 14d Pace ?Recent 14-day HR pace (HRs / games started). v3.5 model feature — captures current form. | Match% ?HR/FB Matchup — combined batter × pitcher HR/FB rate. The headline "how favorable is this matchup" number. | BBE ?Sample size — batted-ball events. <30 = small sample, treat stats with caution. | |
|---|---|---|---|---|---|---|---|---|---|---|---|---|---|---|---|---|
| 1 |

|
Shohei Ohtani | 76 | 🟡 B | +575 | 🔥 HOT | 3 | 0.260 | 93.8 | 14.0% | 26.7% vs RHP | 404 | 18.9% | 54.5% | 32.4% | 24 |
| 2 |

|
Max Muncy | 70 | 🟡 B | +550 | 🌧️ COOL | 11 | 0.246 | 90.5 | 13.3% | 28.6% vs RHP | 408 | 19.1% | 28.6% | 32.3% | 49 |
| 3 |

|
Ryan Ward | 61 | 🔵 C+ | +900 | · | 29 | 0.260 | 89.6 | 10.2% | 30.0% vs RHP | 394 | 16.7% | 0.0% | 28.7% | 14 |
| 4 |

|
Freddie Freeman | 59 | 🟠 C | +700 | 🌧️ COOL | 44 | 0.200 | 90.7 | 11.6% | 18.5% vs RHP | 396 | 14.7% | 23.1% | 22.2% | 39 |
| 5 |

|
Dalton Rushing | 54 | 🟠 C | +750 | 🌧️ COOL | 62 | 0.227 | 88.9 | 10.4% | 41.2% vs RHP | 396 | 7.1% | 0.0% | 20.3% | 20 |
| 6 |

|
Andy Pages | 52 | 🟠 C | +850 | 🌧️ COOL | 76 | 0.208 | 89.6 | 9.8% | 26.1% vs RHP | 390 | 15.8% | 0.0% | 12.6% | 41 |
| 7 |

|
Mookie Betts | 47 | ⚪ D | · | 🌧️ COOL | 105 | 0.166 | 89.8 | 9.4% | 15.0% vs RHP | 385 | 8.1% | 15.4% | 8.8% | 43 |
| 8 |

|
Alex Freeland | 36 | ⚪ D | +900 | 🌧️ COOL | 191 | 0.109 | 89.5 | 8.5% | 10.7% vs RHP | 373 | 3.6% | 0.0% | 8.4% | 21 |
| 9 |

|
Alex Call | 34 | ⚪ D | +950 | 🔥 HOT | 202 | 0.058 | 83.8 | 5.2% | 0.0% vs RHP | 368 | 20.0% | 33.3% | 6.4% | 17 |
9 batters
| # | Batter | Score | Tier | Odds | Form | Rank | ISO ?Isolated Power — career SLG minus AVG. >.220 elite, .180–.220 above avg, <.140 below avg. | EV ?Avg Exit Velocity (mph) — Statcast season-to-date. >92 elite, 89–92 above avg, <86 below avg. | Barrel% ?Barrel rate vs. this pitch mix — percentage of contact classified as barrels (perfect EV + LA combo). >12% elite, 8–12% above avg. | HR/FB ?Batter HR / Fly Ball rate for this matchup. A vs LHP/vs RHP chip means a handedness split is shown; otherwise the value is overall. | HR Dist ?Average distance (ft) of this batter's HRs. >400ft elite raw power, 380–400 above avg. | Sea HR% ?Season HR rate (HRs / PAs so far this year). v3.5 model feature — top backtest contributor. | 14d Pace ?Recent 14-day HR pace (HRs / games started). v3.5 model feature — captures current form. | Match% ?HR/FB Matchup — combined batter × pitcher HR/FB rate. The headline "how favorable is this matchup" number. | BBE ?Sample size — batted-ball events. <30 = small sample, treat stats with caution. | |
|---|---|---|---|---|---|---|---|---|---|---|---|---|---|---|---|---|
| 1 |

|
Byron Buxton | 71 | 🟡 B | +575 | · | 8 | 0.335 | 90.9 | 8.5% | 36.2% vs RHP | 402 | 34.3% | 46.2% | 29.5% | 43 |
| 2 |

|
Kody Clemens | 53 | 🟠 C | +850 | 🌧️ COOL | 71 | 0.227 | 92.2 | 6.8% | 19.1% vs RHP | 388 | 13.5% | 18.2% | 14.3% | 40 |
| 3 |

|
Royce Lewis | 49 | ⚪ D | · | 🌤️ WARM | 90 | 0.161 | 88.5 | 7.1% | 20.0% vs RHP | 397 | 17.9% | 30.8% | 16.4% | 39 |
| 4 |

|
Brooks Lee | 46 | ⚪ D | · | 🌧️ COOL | 108 | 0.187 | 87.6 | 4.2% | 21.9% vs RHP | 369 | 16.9% | 25.0% | 15.5% | 47 |
| 5 |

|
Ryan Kreidler | 45 | ⚪ D | · | 🌤️ WARM | 116 | 0.221 | 88.2 | 6.2% | 27.3% vs RHP | 409 | 5.6% | 0.0% | 14.5% | 24 |
| 6 |

|
Victor Caratini | 42 | ⚪ D | · | 🔥 HOT | 139 | 0.131 | 89.3 | 5.5% | 22.7% vs RHP | 401 | 7.7% | 50.0% | 14.4% | 25 |
| 7 |

|
Josh Bell | 41 | ⚪ D | +900 | · | 148 | 0.147 | 89.6 | 6.0% | 21.9% vs RHP | 402 | 8.9% | 18.2% | 9.5% | 40 |
| 8 |

|
Trevor Larnach | 39 | ⚪ D | +1000 | 🌤️ WARM | 167 | 0.150 | 86.2 | 5.1% | 13.5% vs RHP | 406 | 6.3% | 22.2% | 10.6% | 33 |
| 9 |

|
Tristan Gray | 32 | ⚪ D | · | ❄ COLD | 208 | 0.112 | 88.9 | 4.9% | 15.0% vs RHP | 389 | 8.7% | 0.0% | 7.7% | 14 |